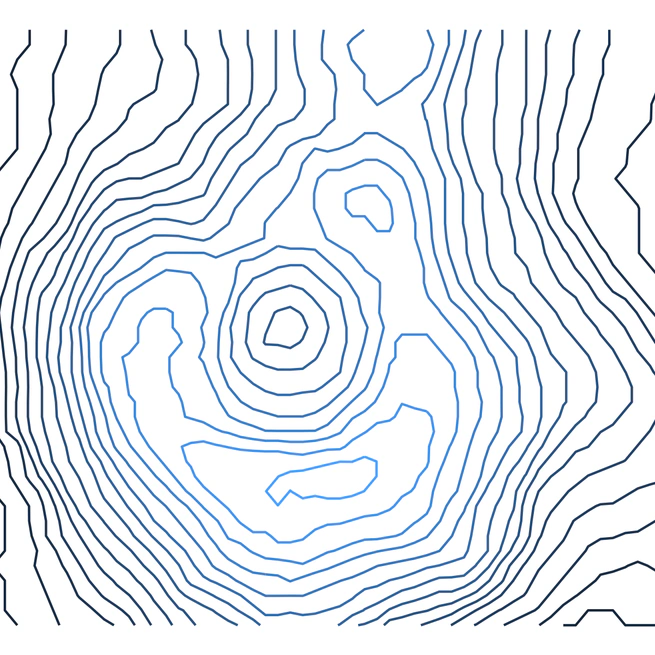
Contour Plots with ggplot2
Contour lines, or isolines, are curves outlining the x-y coordinates of a 3D surface having a given elevation. It’s like cutting the tops of mountains off at set elevations, and tracing the shapes formed by the new (flat) mountain tops.
Jul 10, 2025
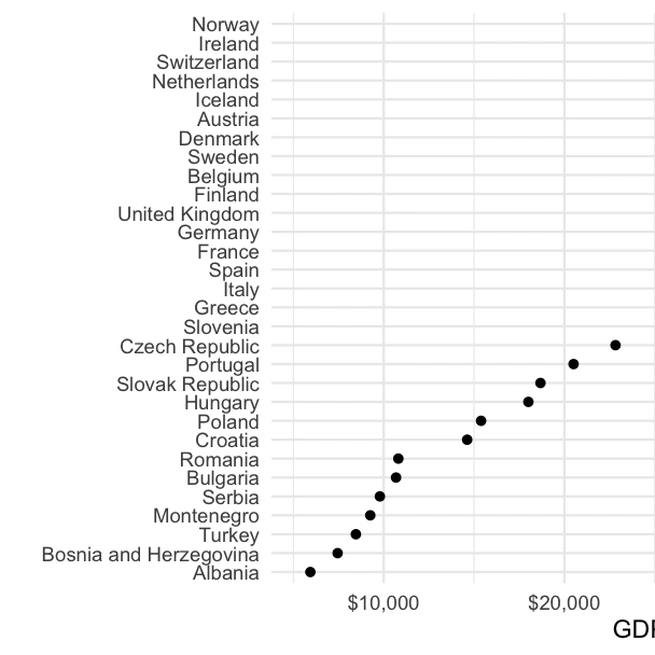
Communicating Data
Some best practices for communicating data through visuals. Inspired by Claus Wilke's ["Fundamentals of Data Visualization"](https://clauswilke.com/dataviz).
Sep 15, 2020
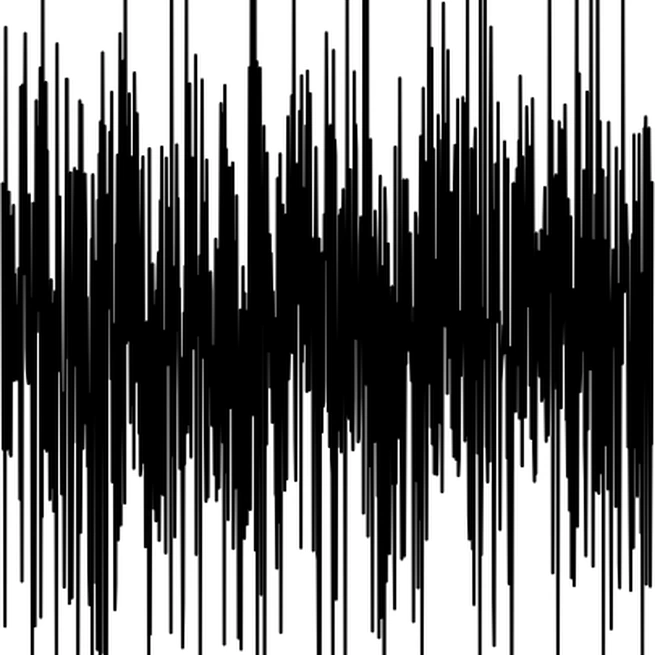
JAGS Tutorial
JAGS is a language that allows you to run Bayesian analyses. It gets at the posterior by generating samples based on the posterior and statistical model. You’ll need to download and install JAGS.
Mar 3, 2018
ggplot2 tutorial
Two youtube videos (embed)
Mar 3, 2018
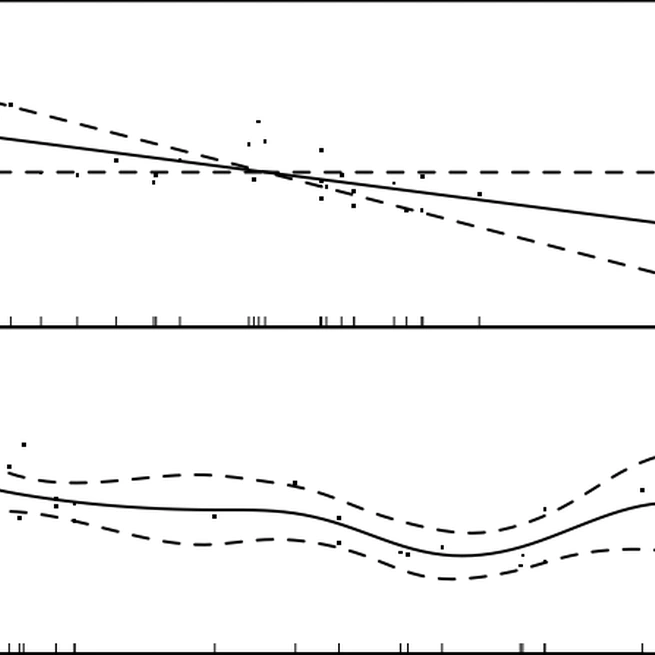
Generalized Additive Models
Generalized Additive Models To fit a GAM in R, we could use: the function gam in the mgcv package, or the function gam in the gam package. Differences between the two functions are discussed in the “Details” section of the gam documentation in the mgcv package.
Feb 1, 2018
Mixture distributions
UPDATE: For a clean implementation of mixture distributions, check out the distplyr R package. This tutorial introduces the concept of a mixture distribution. We’ll look at a basic example first, using intuition, and then describe mixture distributions mathematically.
Feb 22, 2017